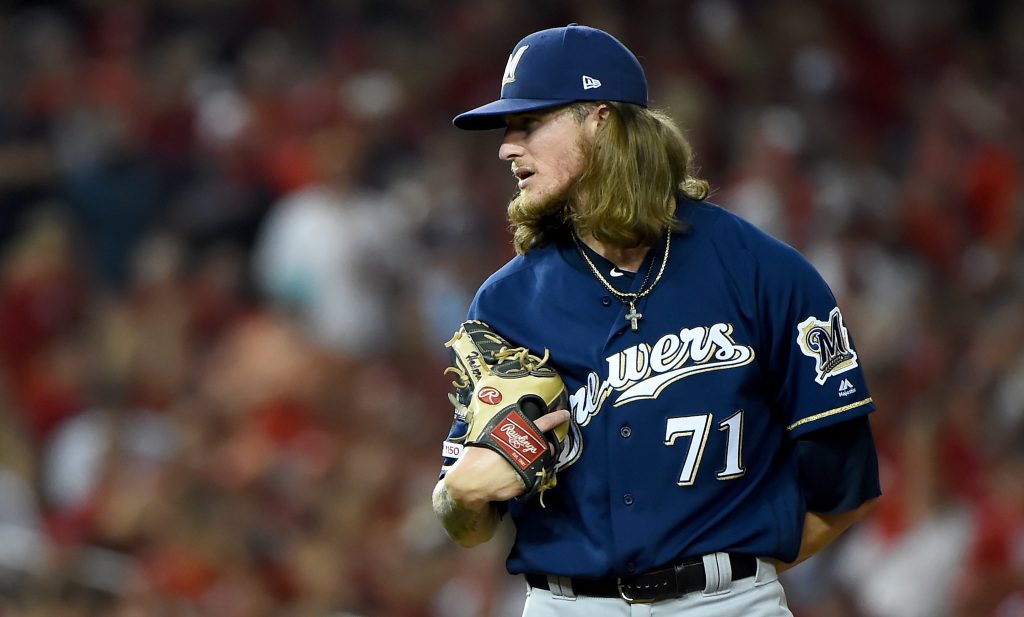
The most reliable pitcher for the Milwaukee Brewers within the last five years has been Josh Hader. Since making his debut in 2017, Hader has made his presence well known not only among Milwaukee Brewers fans but MLB fans as well. Josh Hader has made the All Star game three times in his career and has won the National League Reliever of the Year award three different times. This award is given to the best relief pitcher in the National League that season and Hader has done that three times in his career. He added his third Reliever of the Year award in the 2021 season. This article will break down Josh Hader’s phenomenal season by showcasing three different metrics including ERA, or Earned run average, saves, and strikeouts.

- ERA, or Earned run average, is a statistic that calculates the amount of runs given up by a pitcher per nine innings. If a pitcher gives up three runs in nine innings then that pitcher would have a 3.00 ERA which would be considered above average. To put that into perspective, the average ERA throughout the league was 4.26. This means that an average pitcher would give up 4.26 runs per nine innings. Josh Hader led all relief pitchers in ERA with a 1.23 ERA. He only gave up 1.23 runs per nine innings which is absolutely incredible and is considered a historic season by a relief pitcher. Hader gave up the least amount of runs per nine innings through the entire league.
- Next, let’s talk about the saves statistic. What is a “save”? A save is a statistic used for a pitcher who finishes and wins the ballgame, most of the time within the ninth inning of a game. Along with winning the game, the lead from the opposing team cannot be more than a three run differential. Josh Hader had 34 saves in the 2021 season which was fourth in the MLB. Along with that, he had the best save percentage in the MLB. Hader had 34 saves out of 35 potential opportunities which is equivalent to .971% of save opportunities. The next highest relief pitcher had a .958 save percentage. This statistic is incredibly important because it’s vital for a relief pitcher to clinch a victory at the end of the game, especially when the game is close in score. Having a reliever that can clinch victories when up by a short amount is crucial for winning ball clubs.
- Lastly, Josh Hader was fourth in strikeouts throughout all of baseball and was first within the National League among relievers. A strikeout occurs when a pitcher gets a hitter to accumulate three strikes. A strike can consist of a batter swinging at the baseball and missing. A strike can also come from a foul ball, which is when a batter hits a baseball out of fair play. Once three strikes are accumulated, then a strikeout happens which results in one out. Josh Hader had 102 strikeouts through the 2021 season which ranked first in the National League. This just shows how dominant Josh Hader was that he was able to get hitters out by making them miss his pitches and outsmarting them with each pitch.

Josh Hader had an incredible 2021 season that will go down as one of the greatest seasons by a relief pitcher ever in the game of baseball. With the incredible numbers revolving around ERA, saves and strikeouts, Hader was able to dominate opposing hitters and make it a nightmare to face off against him. Josh Hader had the best season of his short career and hopefully will continue to scare hitters in Milwaukee for a long time.


